Easily View Analytics in Google Forms (2024) - Supatool
Fast navigation
Overwhelmed by the flood of data from your Google Form? You're not the only one.
Turning this overwhelming information into actionable insights is key in any domain, be it business, education, or personal projects.
This concise guide will take you through the essentials of Google Forms analytics.
Discover streamlined methods to analyze responses, identify trends, make informed decisions, and integrate tools like Google Sheets.
View Analytics in Google Forms Responses Tab
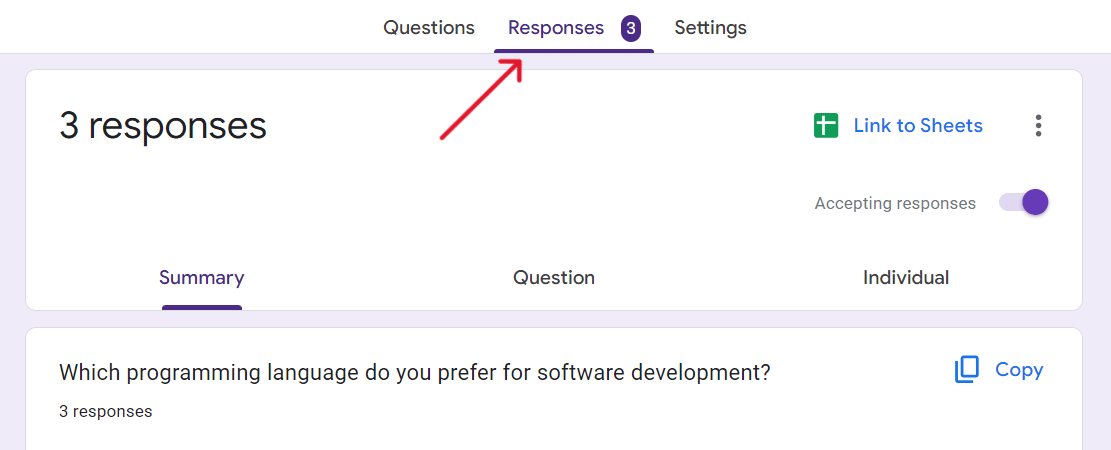
In Google Forms, the Responses tab is a powerful tool for visualizing your data. Here's how you can make the most of it:
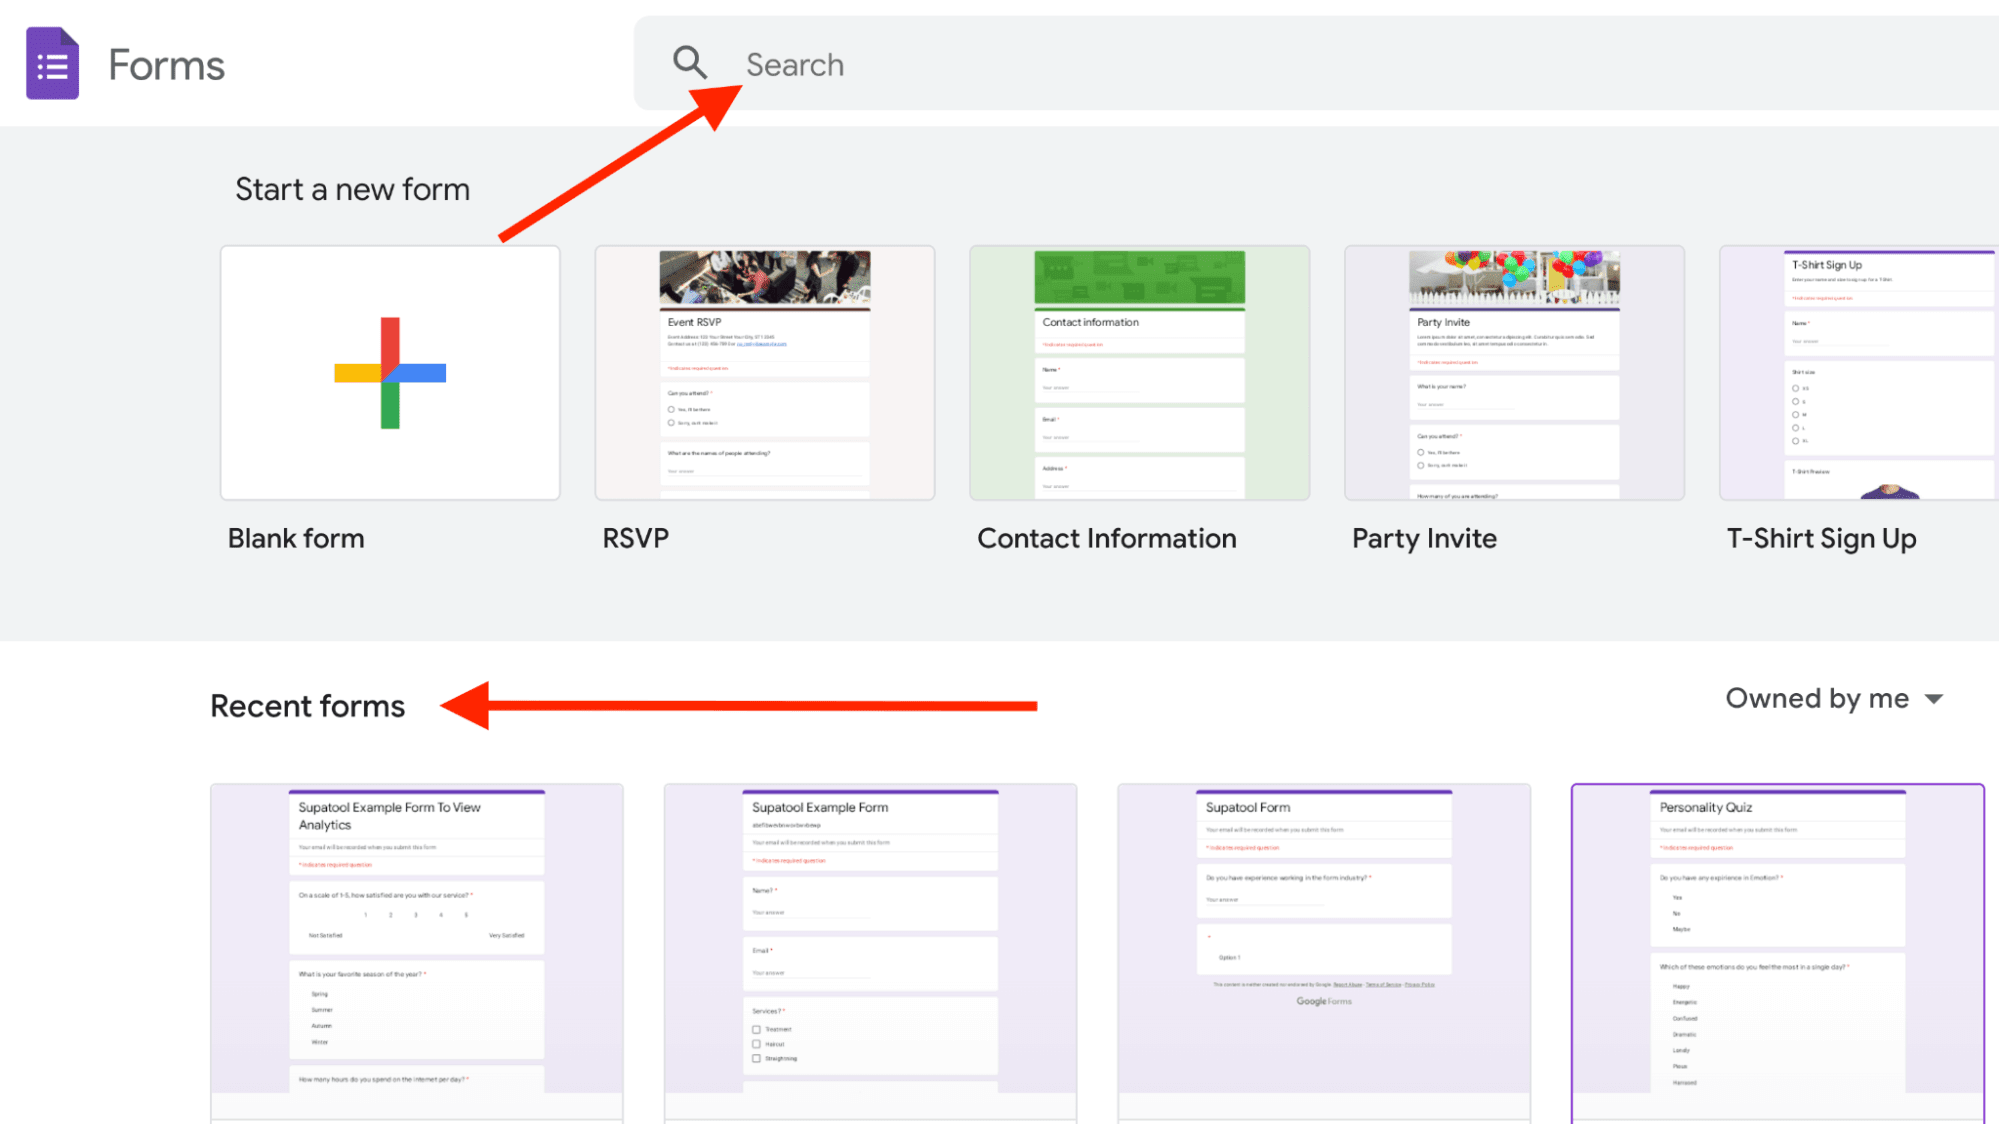
1. Open Your Google Form:
Visit forms.google.com, and log in to access your form, either from the recent forms section or using the search function.
3. Explore the Summary View:
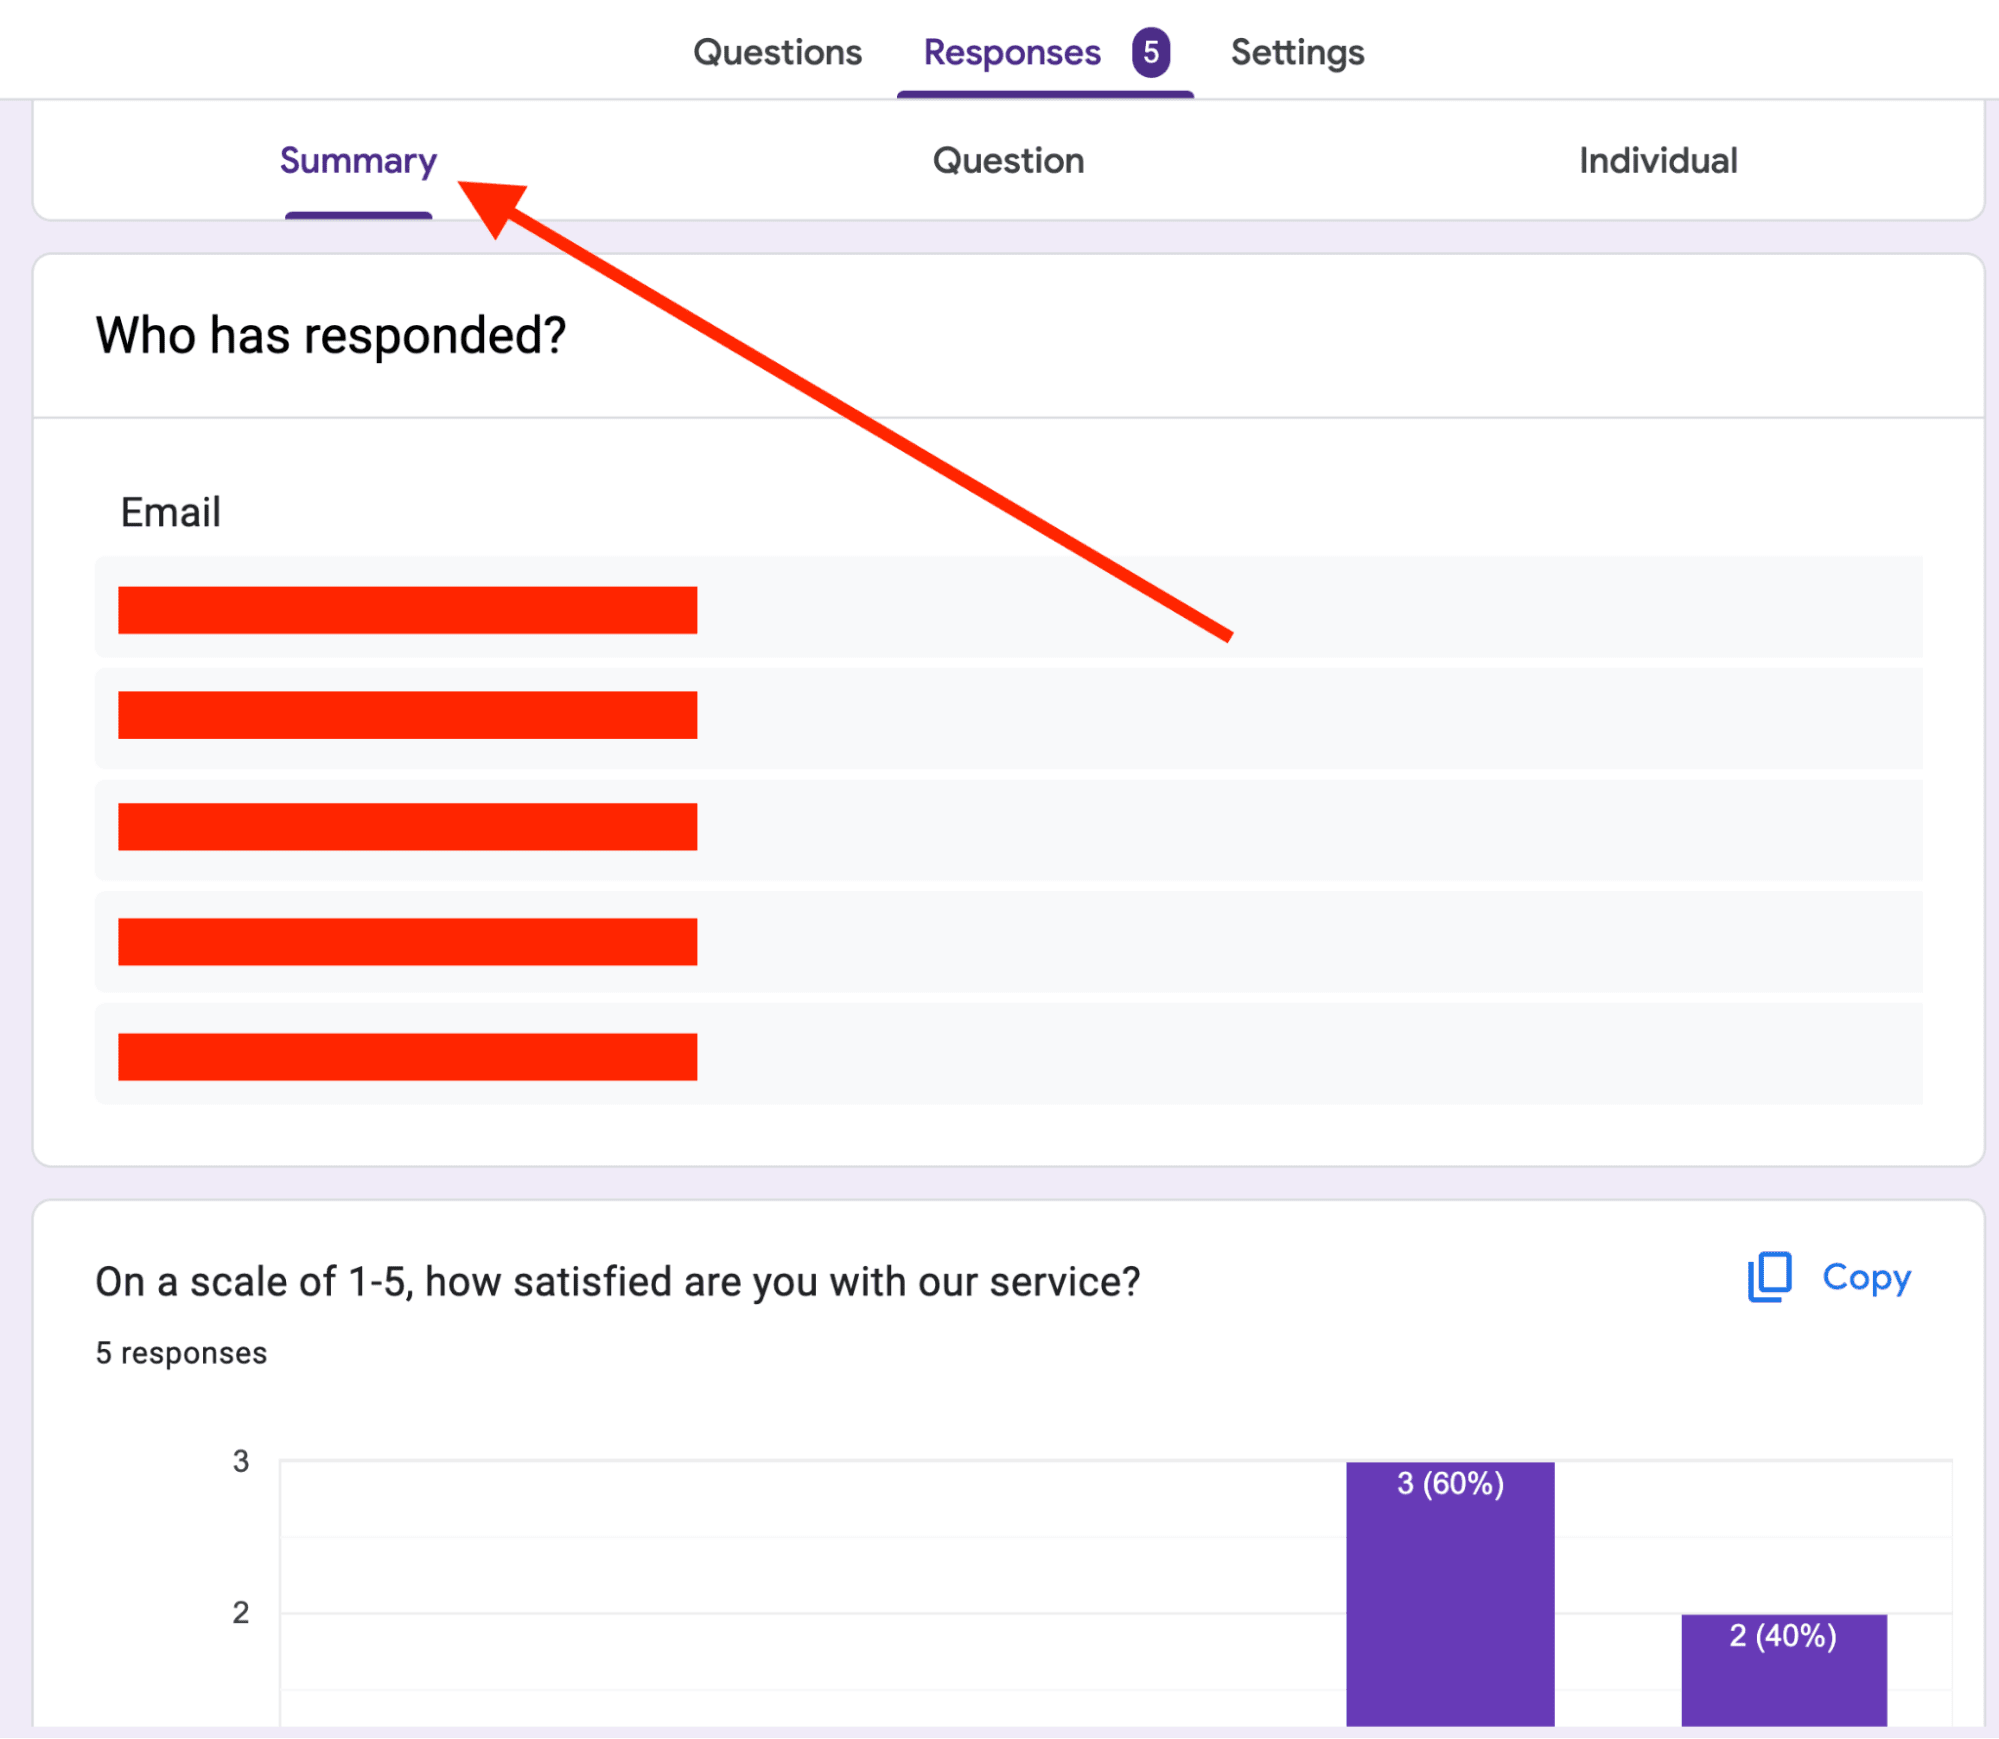
The Summary section provides an overview of all responses, represented through a variety of charts.
Depending on your question types, you'll see:
Ideal for linear scale questions, they help in understanding the distribution of responses:
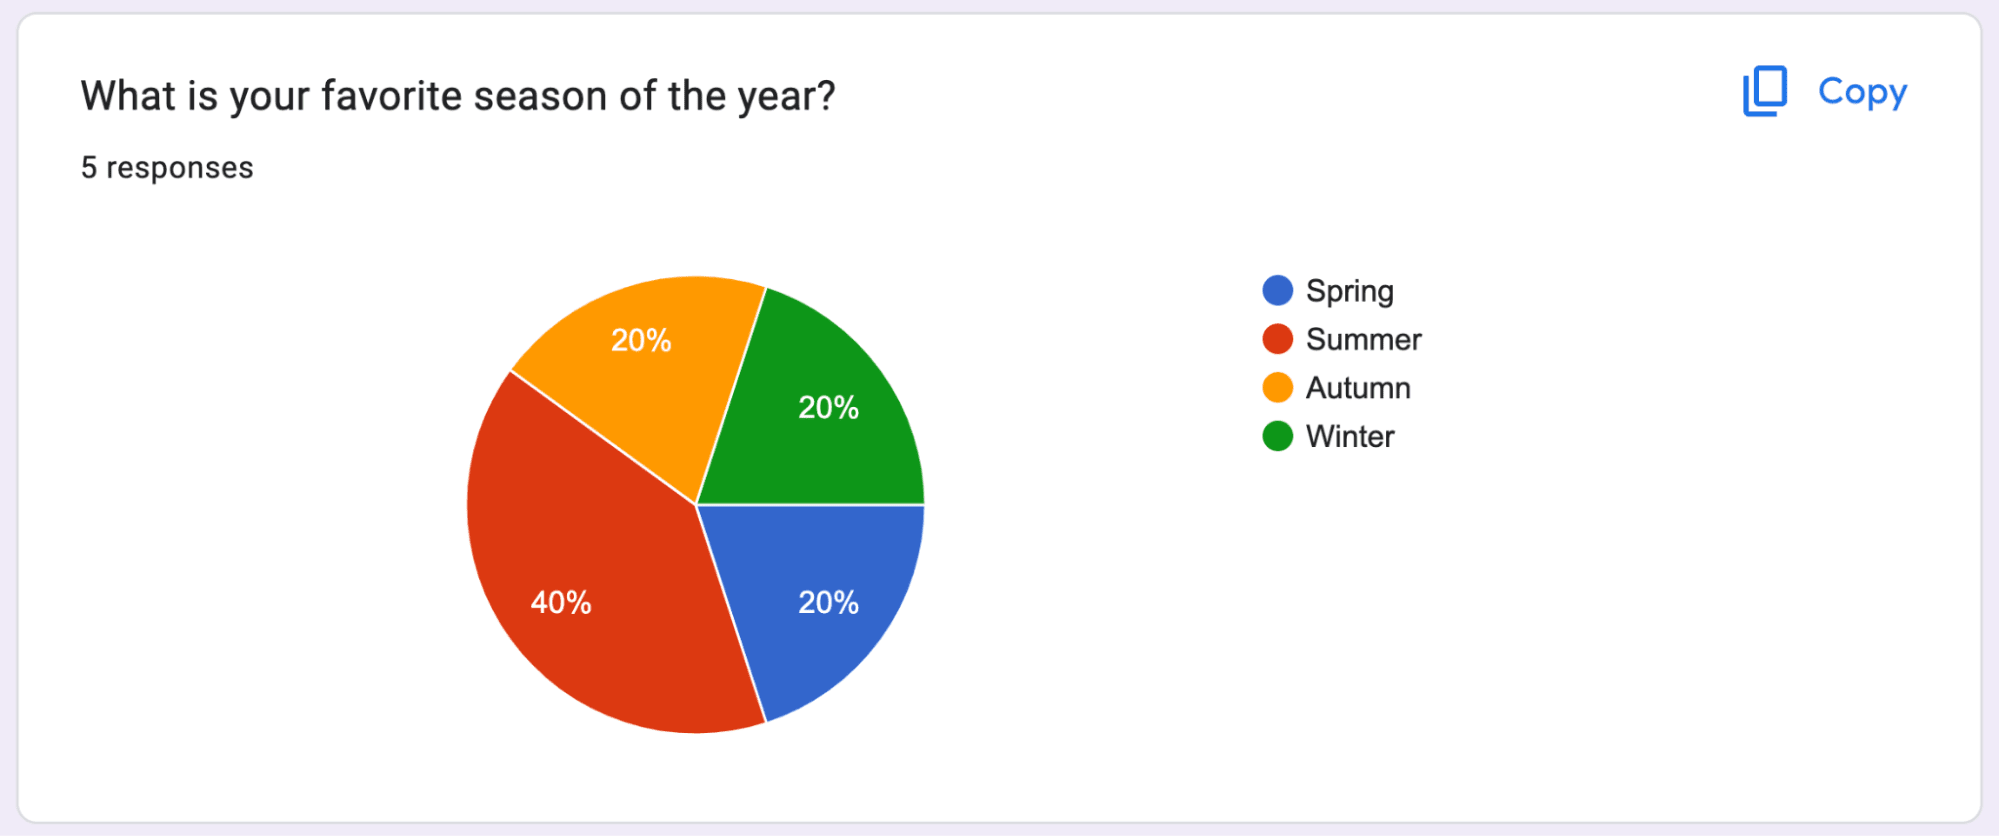
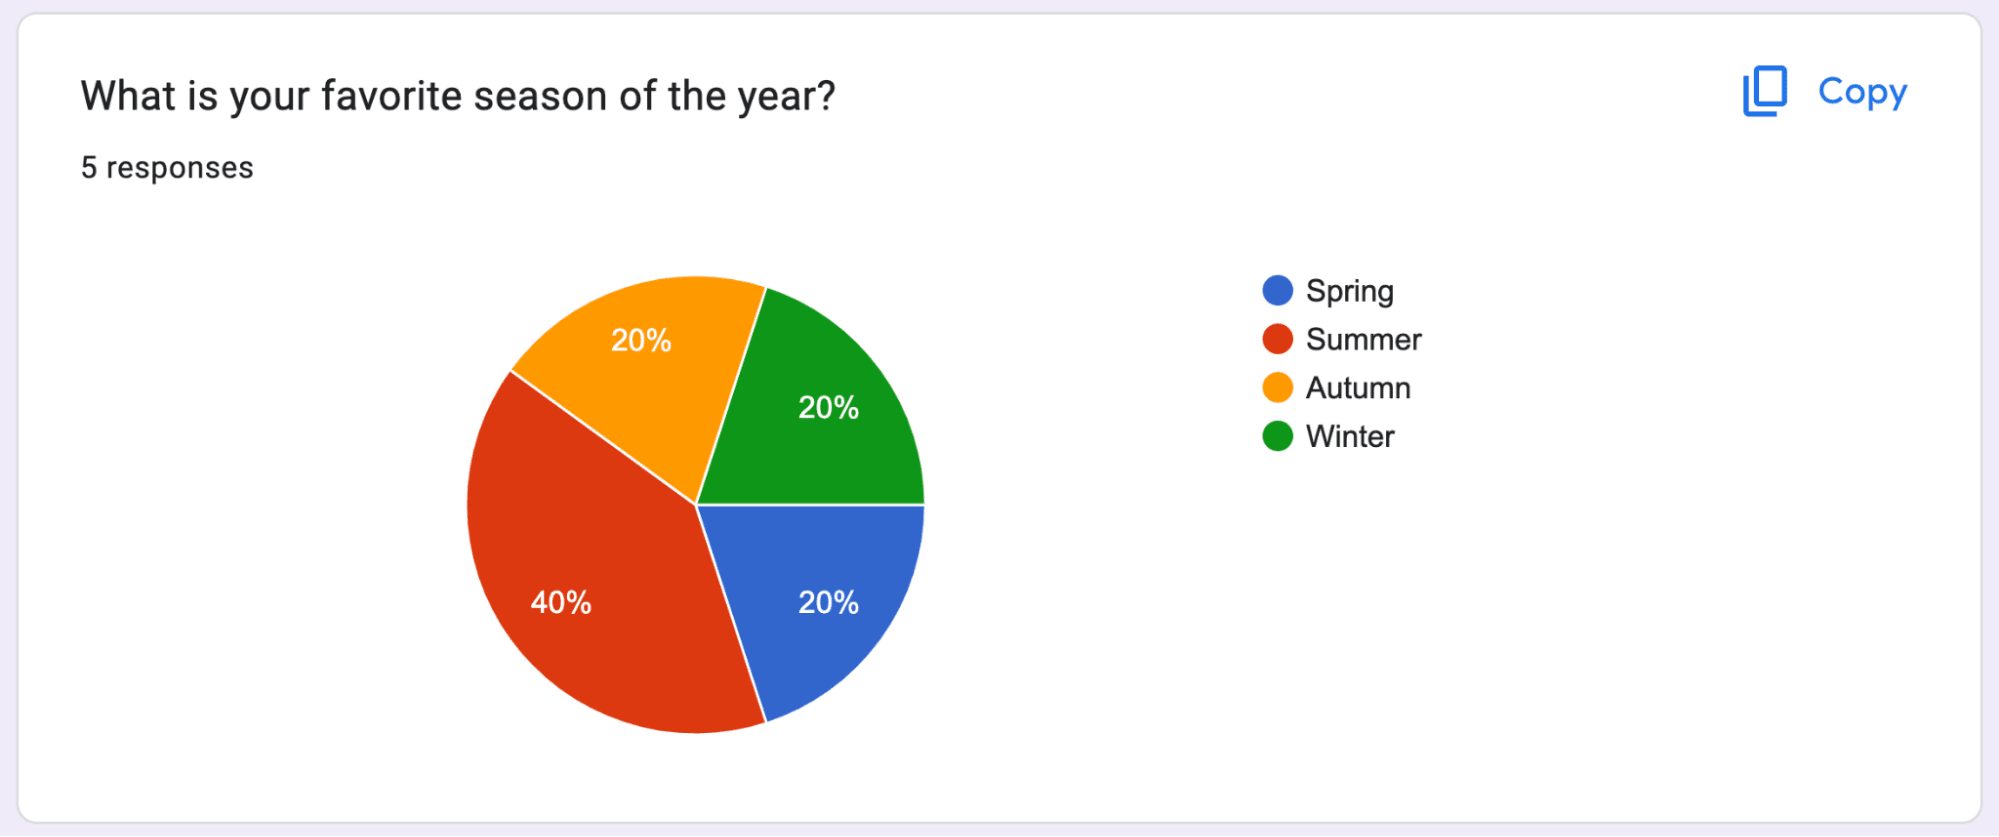
• Pie Charts: Used for multiple-choice questions, offering a clear visual of the proportion of each choice:
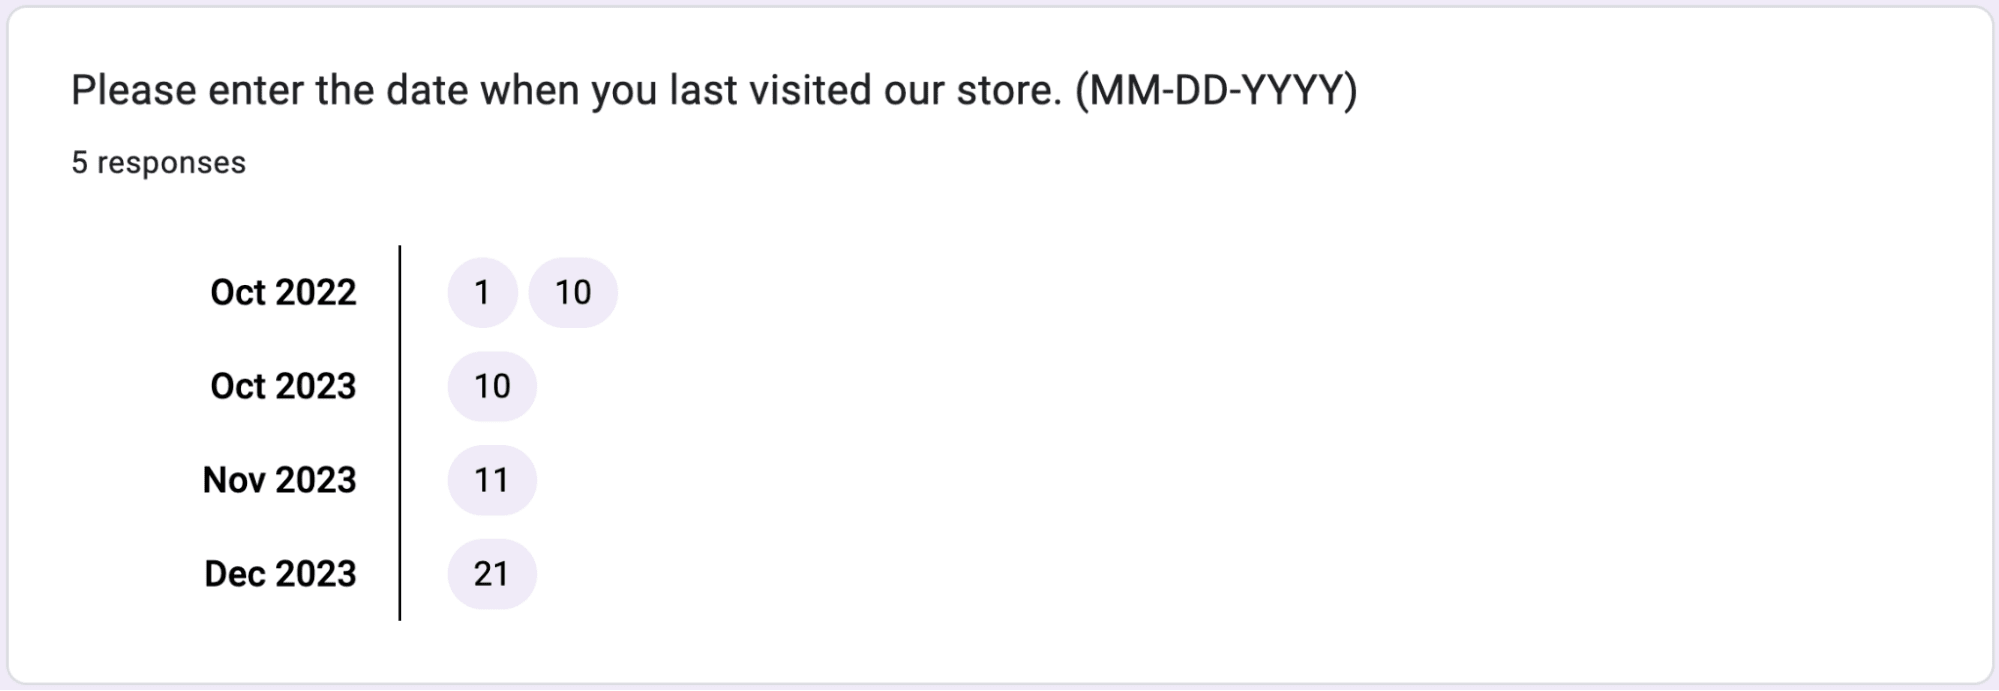
• Line Charts: Useful for tracking trends over time, especially if your form includes date or time-based questions:
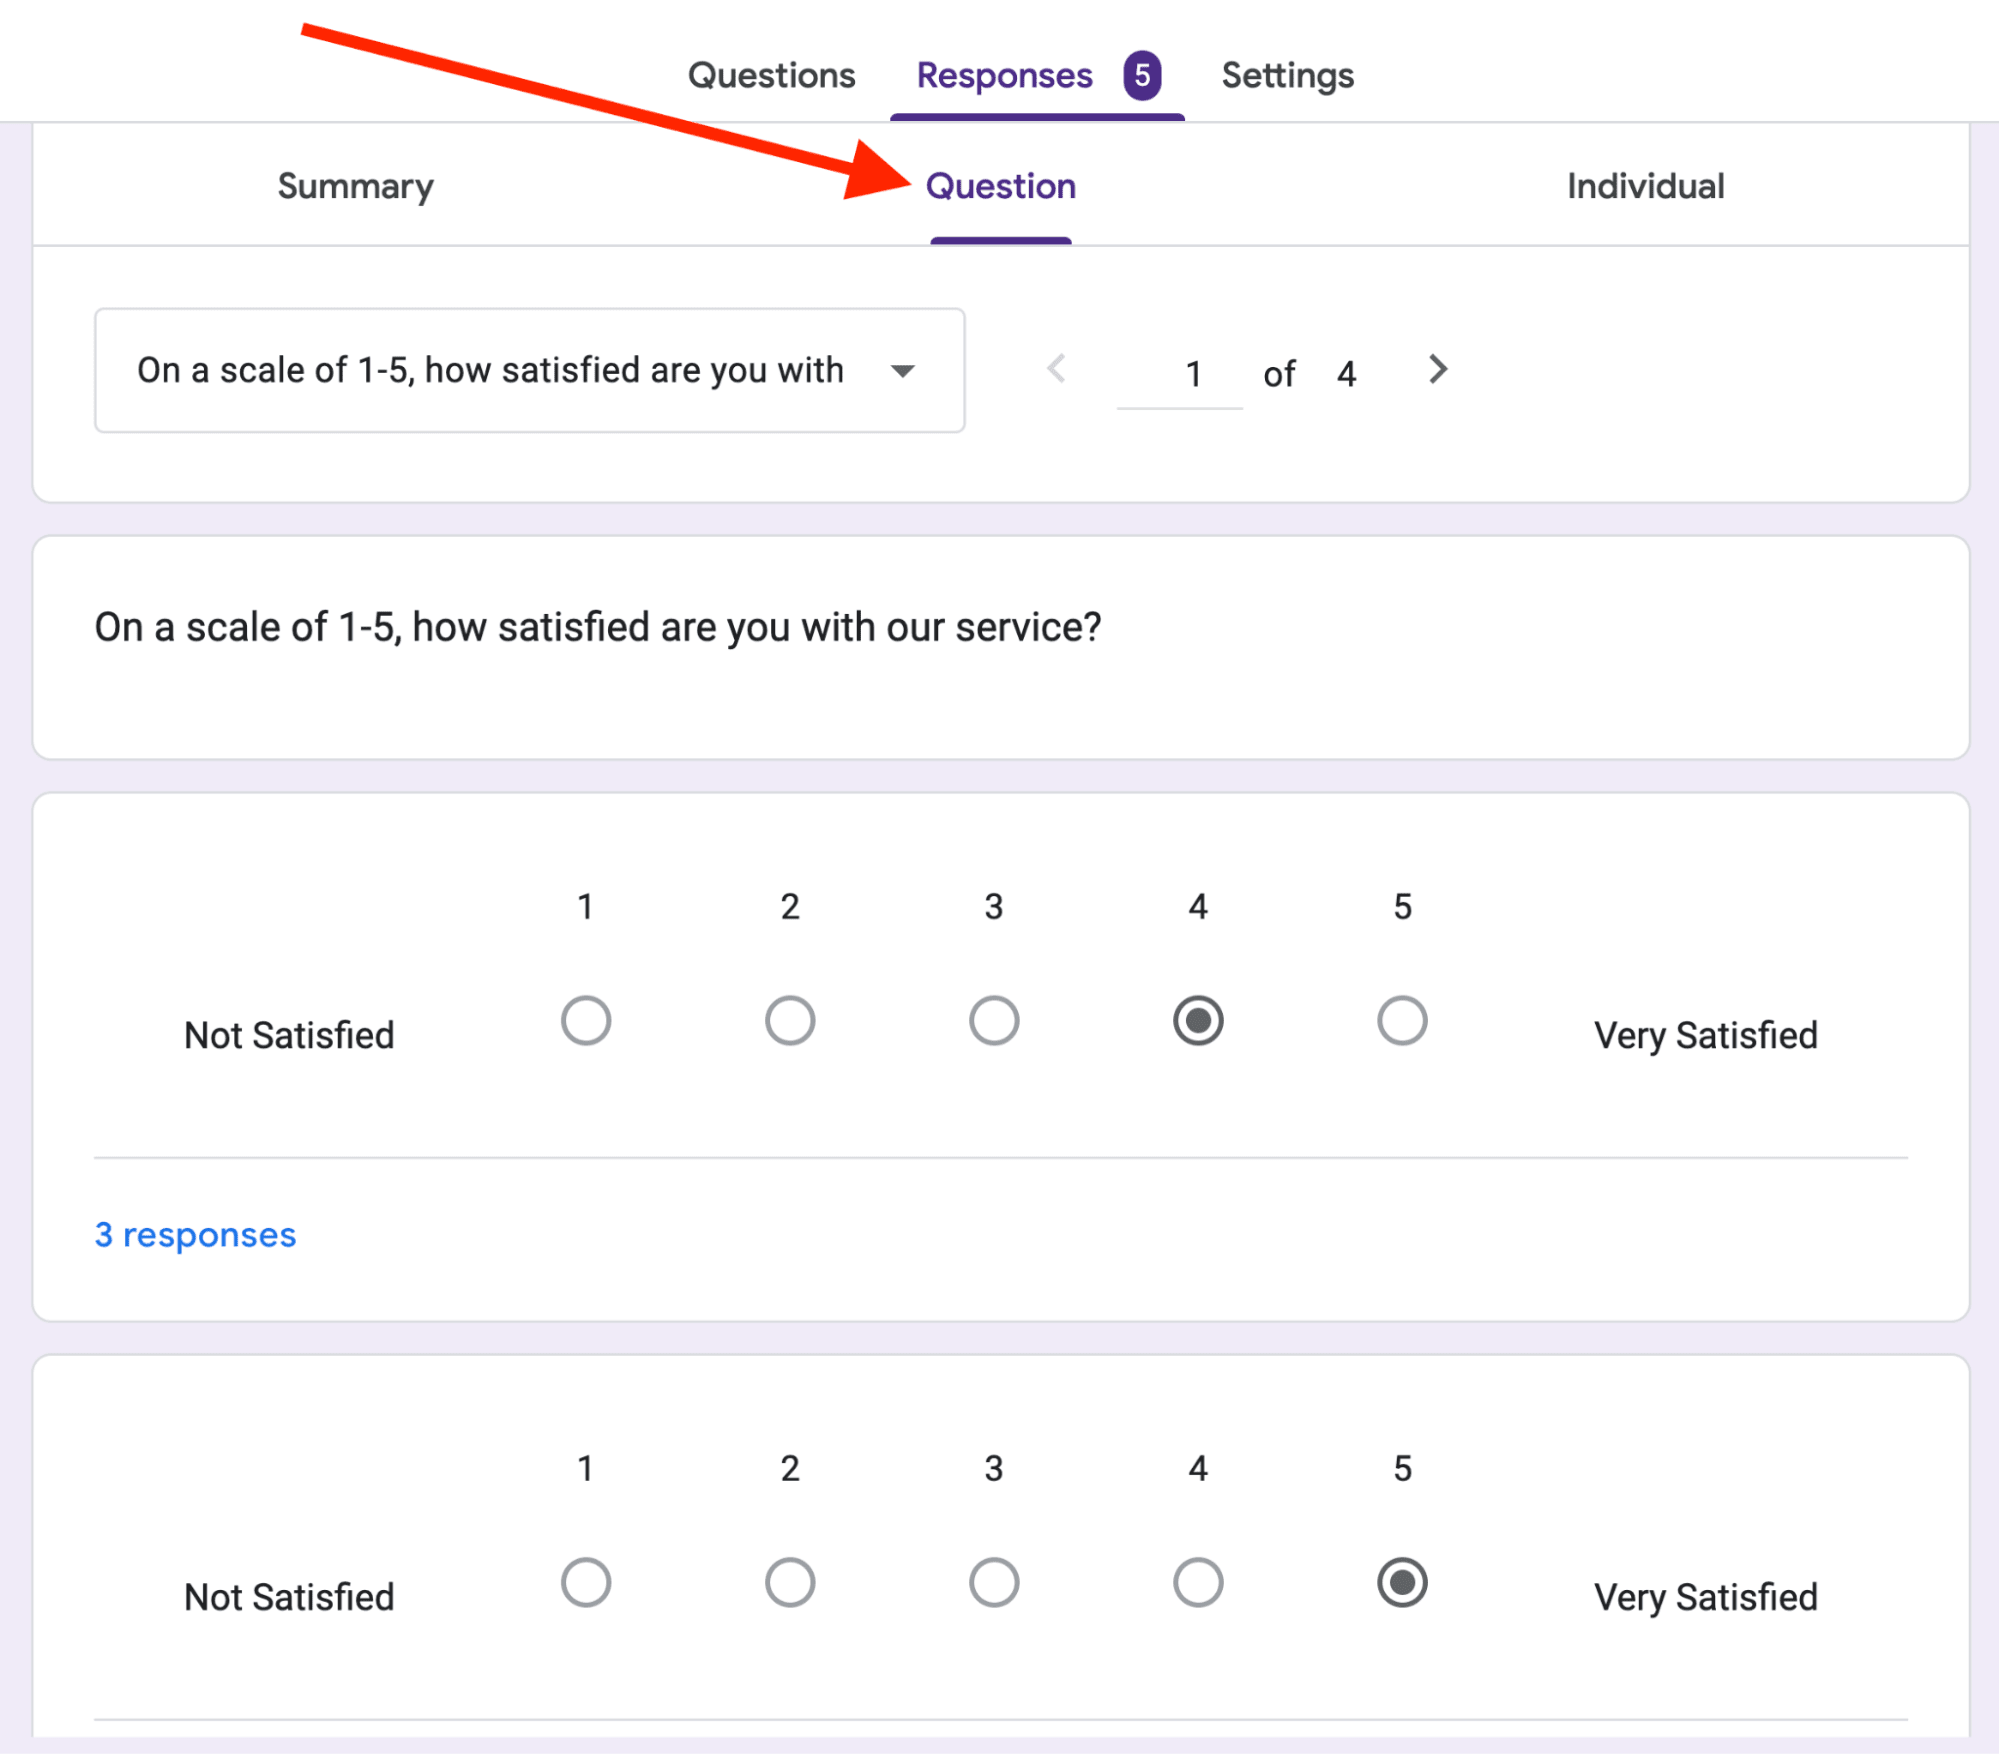
5. Examine Individual Responses:
For a detailed view of each participant's answers, switch to the Individual tab. This is particularly useful for qualitative analysis or when you need to review answers in detail.
Finished!
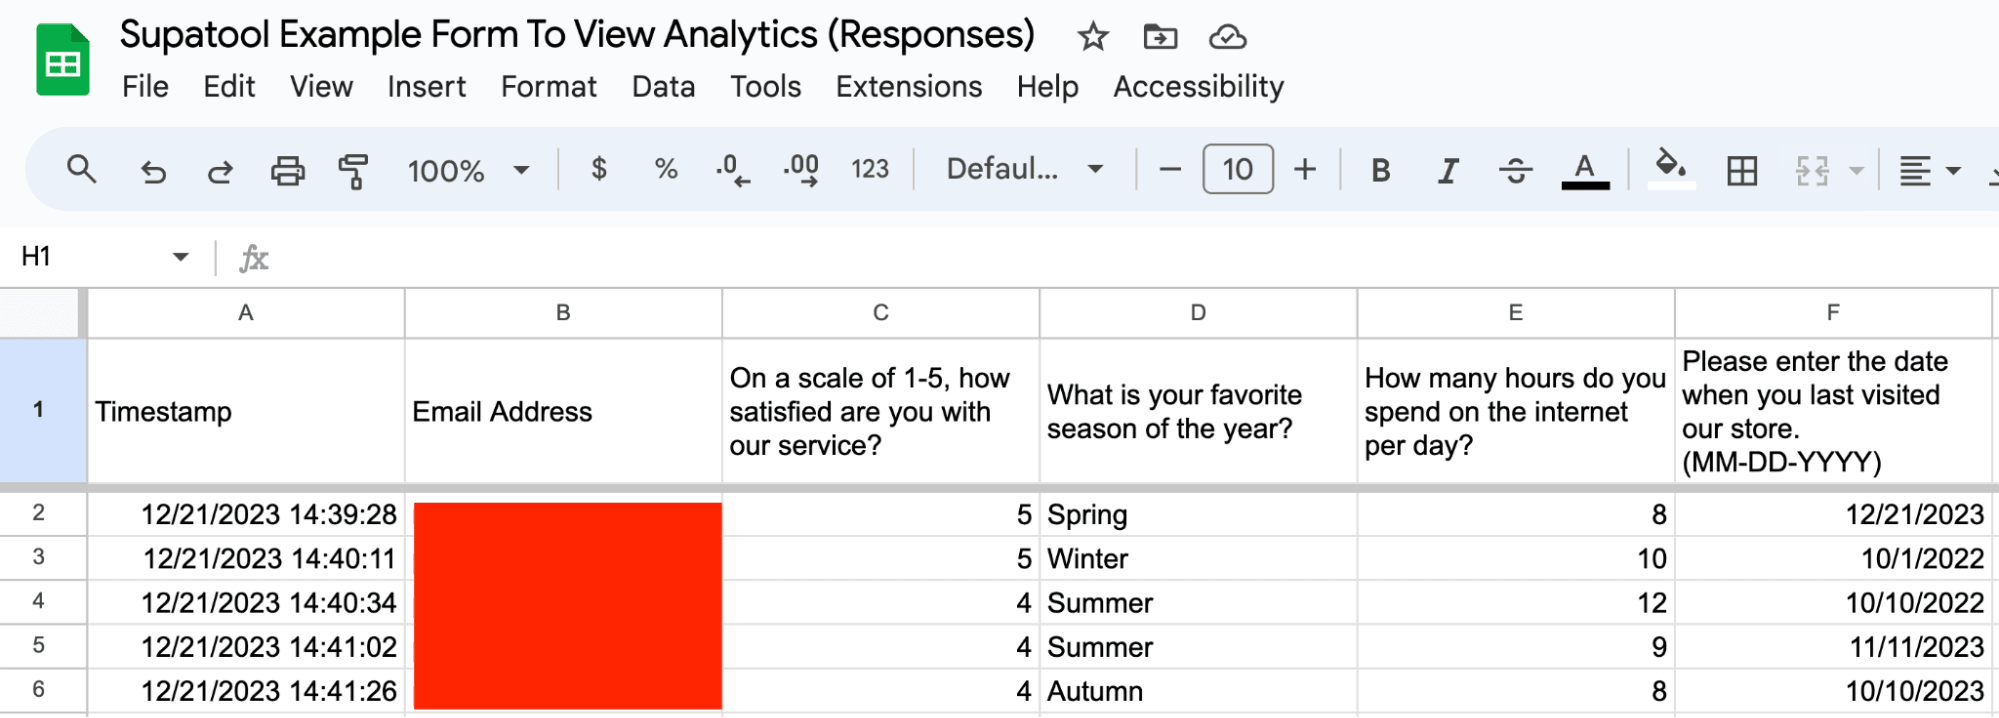
Integrate Google Forms with Google Sheets For Analysis
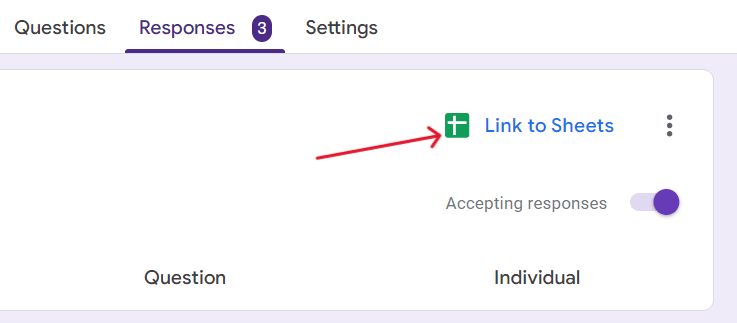
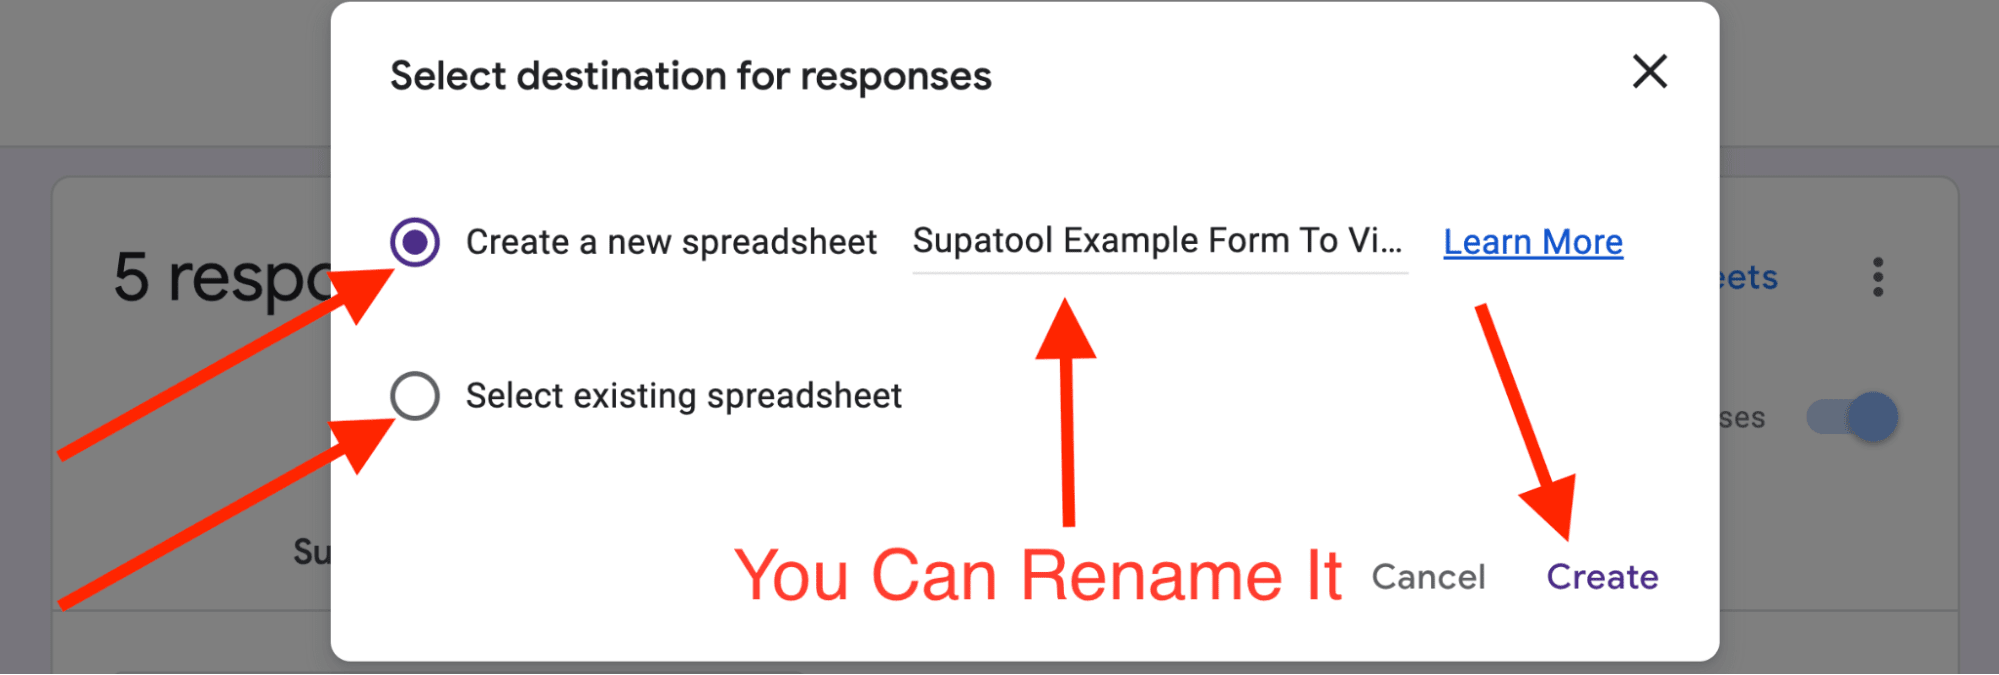
Sometimes, you need more robust tools for your data analysis. Google Sheets comes to the rescue here. Follow these steps to sync your Google Form responses with a Google Sheet:
1. Open Your Google Form:
As before, find and open your form at forms.google.com or through your Google Drive.
2. Go to the Responses Tab:
Click on this tab to view all the submitted responses.
7. Unlinking a Form from a Sheet:
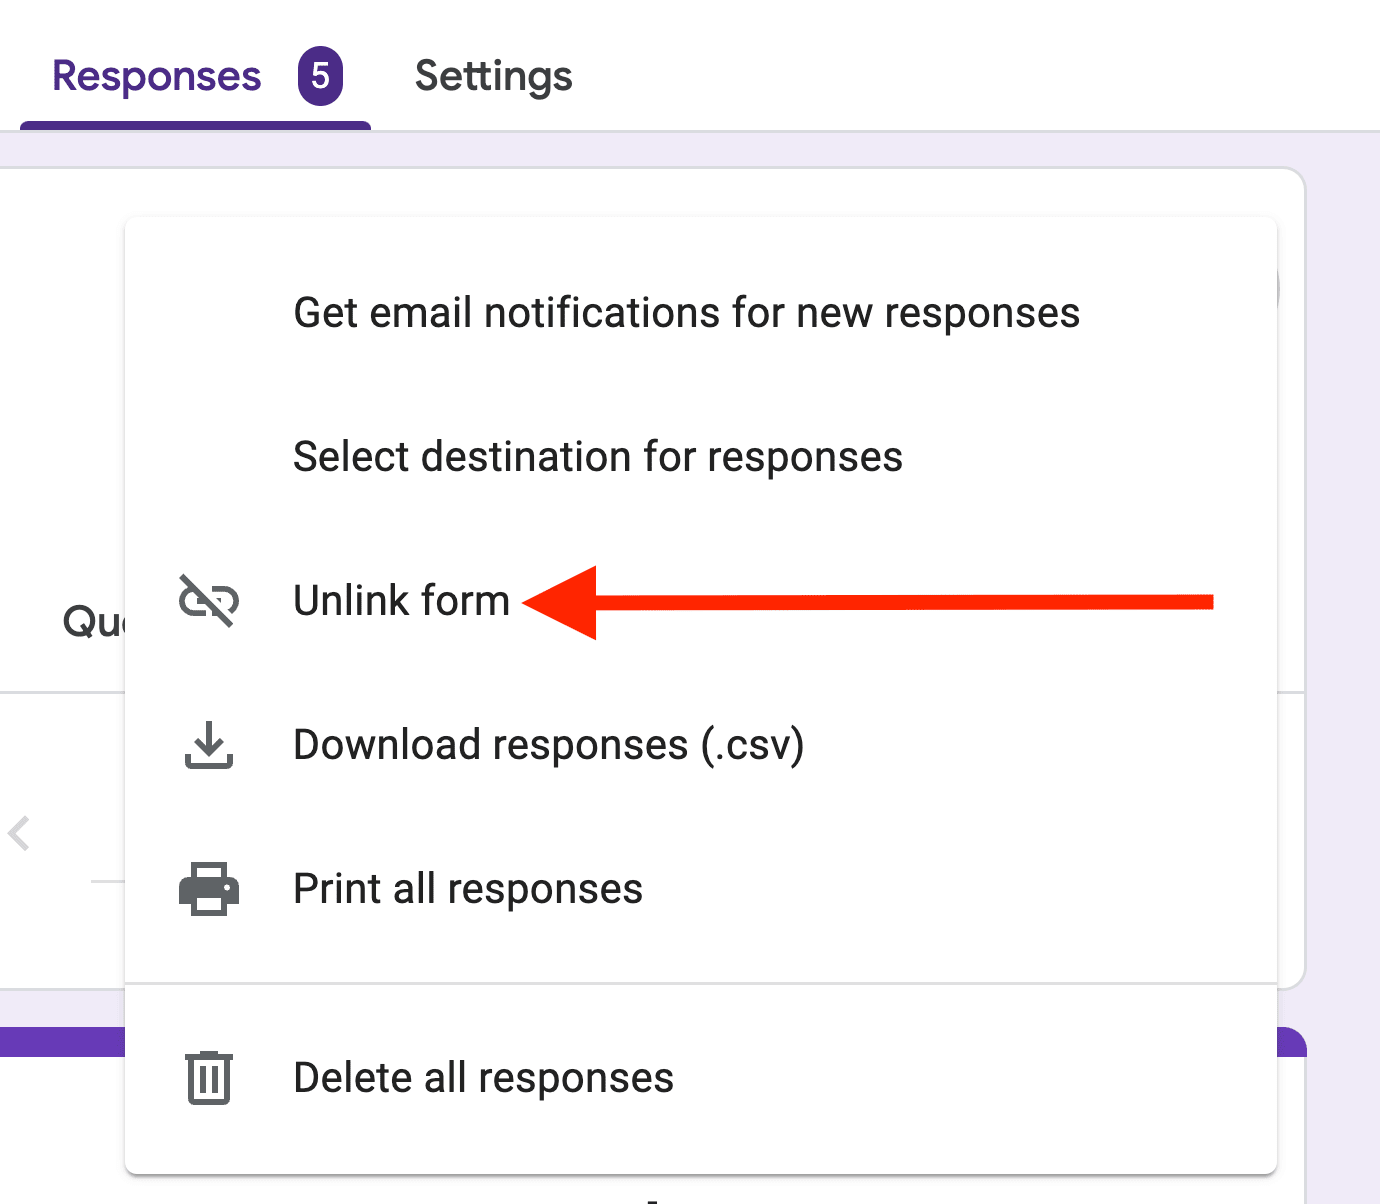
If needed, you can unlink your form from the sheet. Click on the three-dot menu in the Responses tab:
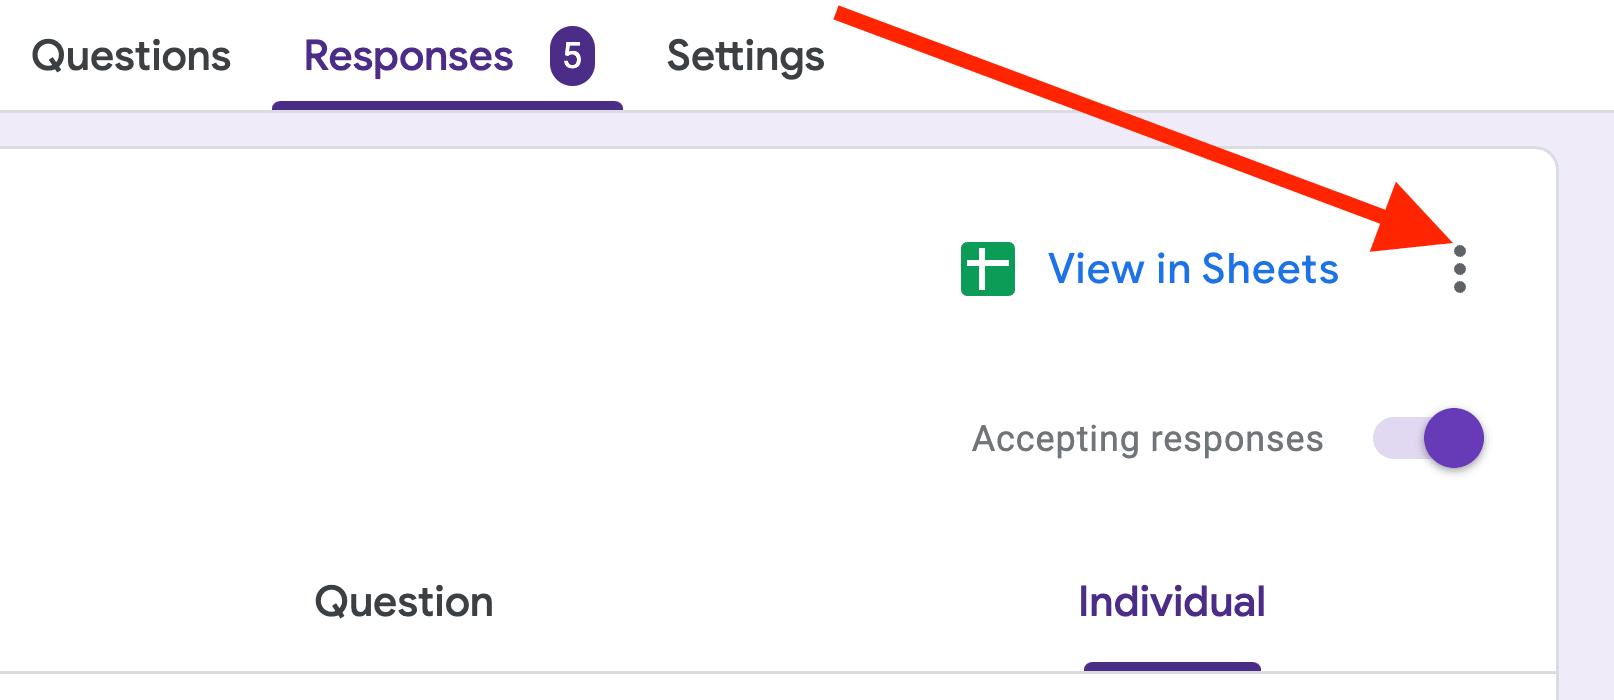
And click on “Unlink Form” to unlink it.

And there you have it! By following these steps, you can effectively view and analyze your Google Forms data.
Whether it's for a quick overview or a deep dive with Google Sheets, these tips should help you make the most out of your collected data.
Don't forget, the key to effective data analysis is in understanding the story your data is telling you. Happy analyzing!
Finished!
