
How to Calculate YoY Growth in Excel: A Comprehensive Guide
Fast navigation
This guide will show you 2 different methods on how to calculate YoY growth in Excel.
Analyzing year-over-year growth is essential for tracking business performance and making informed decisions.
So let’s dive in and calculate YoY growth in Excel!
Understand the Concept of YoY Growth
Year-over-year (YoY) growth compares a metric from one year to the same period in the previous year. This comparison helps eliminate seasonal effects, providing a clearer view of underlying trends and performance.
Real-World Example:
Imagine you are analyzing the sales data of a company for the first quarter of 2026. If the sales in Q1 2025 were $69.8 billion and increased to $80.5 billion in Q1 2026, the YoY growth indicates how much sales have increased over the year.
Common YoY Metrics
Compare the same period (e.g., 2025 vs 2024) and track a small, consistent set:
- Revenue, Gross Profit, Net Income, Gross/Operating Margin
- COGS and Operating Expenses (OpEx)
- Units/Orders and Average Order Value (AOV)
- Subscription: MRR/ARR, Net Revenue Retention (NRR), Churn, ARPU/ARPA
- Acquisition: Leads/Sign-ups, Conversion Rate, Customer Acquisition Cost (CAC)
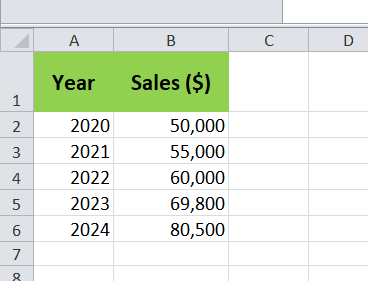
Prepare Your Data in Excel for YoY Growth
Begin by organizing your data in an Excel spreadsheet. For this guide, we will use a sample dataset containing yearly sales figures.
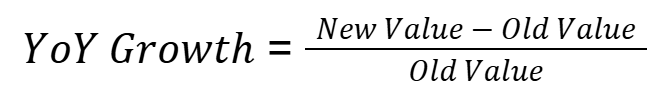
Method 1: Calculate YoY Growth Using the Traditional Formula
The traditional formula for calculating YoY growth is:
 In Excel, this can be implemented as follows:
- Insert a new column for YoY Growth next to your sales data.
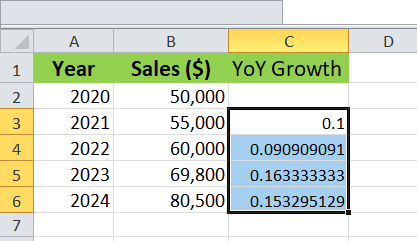
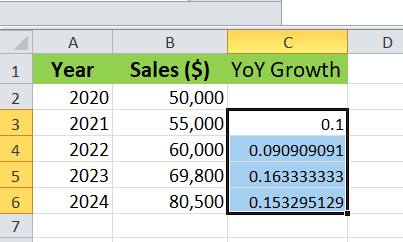
- In the first cell of the YoY Growth column (assuming the first value will be in cell C3), input the formula: =(B3-B2)/B2
3. Press Enter to see the result for the first year.
4. Drag the fill handle down to apply the formula to the remaining cells.
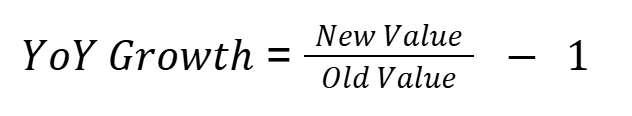
Method 2: Calculate YoY Growth Using the Modern Formula
An alternative method to calculate YoY growth is by using the ratio of the new value to the old value and then subtracting 1:
In Excel, this can be implemented as follows:
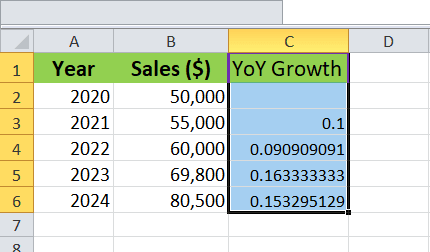
- In the same YoY Growth column, input the formula in the first cell (assuming the first value will be in cell C3): =(B3/B2)-1
2. Press Enter to see the result for the first year.
3. Drag the fill handle down to apply the formula to the remaining cells.
Format the Results as Percentages
To present the YoY growth as percentages:
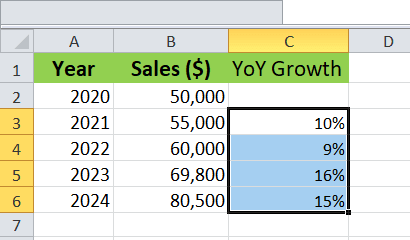
Highlight the YoY Growth column.
Go to the ‘Home’ tab and click on the % icon.
Now the result will show in percentage:
By following these steps, you can effectively calculate and analyze YoY growth in Excel.
This powerful metric provides valuable insights into business performance, helping you track progress and make strategic decisions.
Whether you're analyzing sales figures, revenue, or any other metric, understanding YoY growth in Excel will equip you with the tools to identify patterns and make data-driven choices.